Carbometrix has independently analyzed and computed the carbon emission performance of 22,000 electricity producers worldwide, representing 75% of global production using an asset-based methodology. The assets consist of 60,000 power plants around the world.
In 2020, global electricity production was 28,000 TWh. The electricity and heat sector represents 25% of global greenhouse gas (GHG) emissions.
Electricity is at the heart of the decarbonization of our economic system. We need energy in many industrial processes, and electricity is the source of energy most likely to replace fossil fuels.
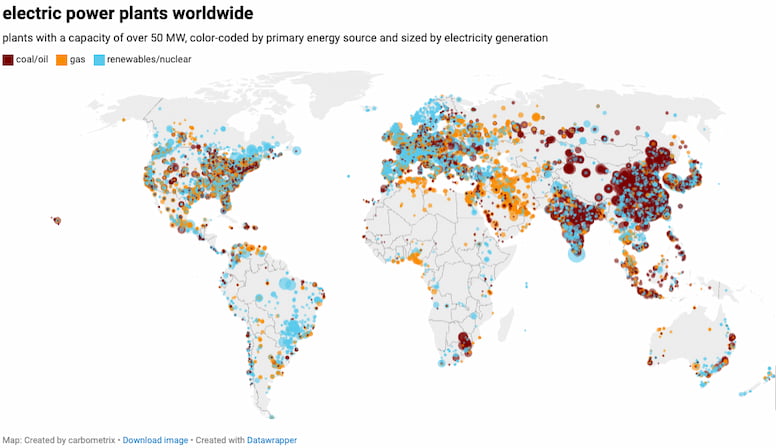
The map below shows the largest power plants.
From primary energy to electricity
Electricity is produced from primary energy found in nature. The three main sources of electricity worldwide are coal (35%), gas (23%) and hydraulic power (16%). Fossil fuels (coal and gas) still account for most electricity generation.
We can break down primary energy sources for electricity generation into seven categories:
Fossil fuels: coal, oil, natural gas. They release CO2 when burnt to power a steam turbine.
Nuclear power plants use the fission of uranium atoms. That fission produces heat which is then transformed into steam and turns the turbine.
Hydraulic power: it uses the force of water to turn blades in a turbine.
Geothermal power plants use water heated by the heat of the earth or steam released from it.
Wind turbines use the force of the wind to drive their propellers.
Solar panels, called photovoltaic panels, produce electricity from the sun.
Biomass is energy made up of organic plant or animal matter (household or agricultural waste). Organic matter is turned into natural gas with a heavy methane component, and that gas is then burnt to generate electricity.
Only hydraulic, geothermal, wind, solar, and biomass are renewable energies.
Assessing carbon performance of electricity generation
The carbon intensity of electricity generation depends on the primary energy used to produce electricity. The most emissive energy sources are fossil fuels, which release GHG into the atmosphere when burnt to power steam turbines.
Carbon intensity is the ratio of greenhouse gas emissions divided by electricity produced. Intensity is expressed in grams of CO2 equivalent per kiloWatt-hour produced. Carbon dioxide equivalent or CO2e means the number of metric tons of CO2 emissions with the same global warming potential as one metric ton of another greenhouse gas.
At Carbometrix, we take a full life cycle approach to electricity generation. We take into account direct emissions at the power plant level and emissions occurring upstream from the plant. Upstream activities include extraction, manufacturing and transport of whatever is needed to produce electricity. For instance, solar energy generation does not emit greenhouse gases directly. However, it involves solar panels, which manufacturing process requires energy and hence emits greenhouse gas.
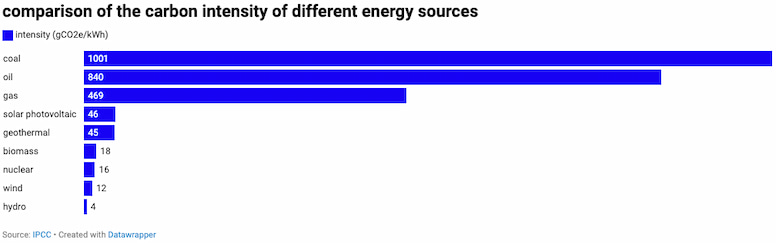
Below is a comparison of the carbon intensity of different energy sources as per the IPCC (Intergovernmental Panel on Climate Change). Fossil fuels’ emissions are considerably higher than any other source of energy.
Ranking of electricity producers
We use the average carbon intensity to rank the top 50 producers. The ranking reflects the operational capacity per energy source of a given electricity producer. We show here a selection of 15 producers.
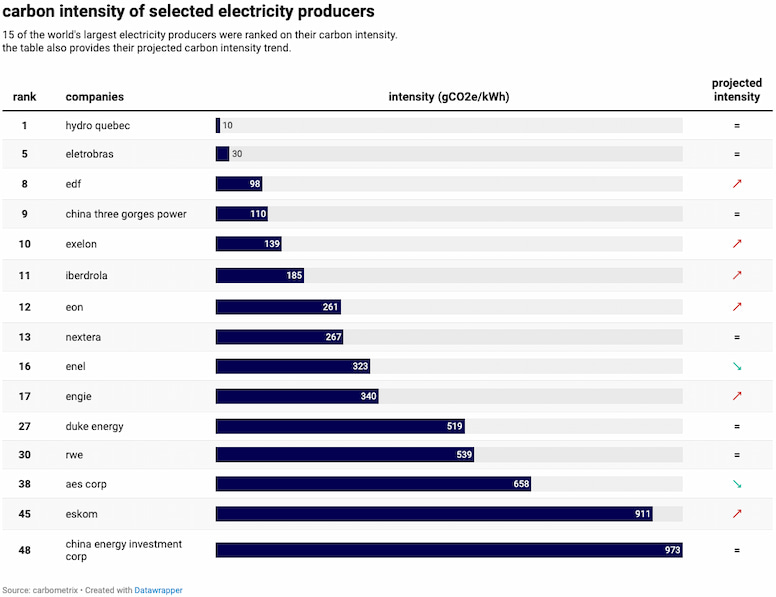
The top producers in our ranking rely primarily on renewable and nuclear energy. There are significant gaps between producers, intensity varies by a factor of 1 to 100.
The least carbon-intensive producer, Hydro Quebec, one of the largest producers of hydroelectricity, has an intensity of 10 gCO2e/kWh. In the top 10, we already reach a carbon intensity ten times higher than that. The most carbon-intensive producers in our ranking have an intensity above 1,000 gCO2e/kWh.
As a reference, the European Taxonomy set a threshold of 100 gCO2e/kWh for electricity generation to be considered green. Only renewable energy meets this target.
Among the top 10, we find world leaders in electricity production. For instance, EDF is the fourth biggest electricity producer in the world. Only producers such as EDF relying on nuclear energy combine a low carbon intensity and a high level of production.
We also calculate the forward-looking performance of companies to 2030. We do this by using electricity producers' announcements at the plant level, whether it is closing or opening.
Conclusion
The electricity sector is highly emissive. Decarbonizing is essential for our societies to be sustainable.
There is space for improvement with a massive impact on climate. A mere 10% reduction in electricity production intensity would result in 1 Gt of CO2e saved per year, accounting for 2% of all GHG emissions. Utility companies need to take action urgently and technological solutions are already available.
Other industries can reduce their emission by electrifying their processes. For instance, electric cars could dramatically reduce their CO2 emissions, if they relied on low-carbon electricity (if you are interested in the topic, make sure to check out our automakers ranking).
The table below presents the 50 companies analysed by Carbometrix for the purpose of this study. Please see below the detailed methodology.
aes corp | eskom |
american electric power (aep) | exelon |
atomenergoprom | fortum |
berkshire hathaway energy | hydro quebec |
cez | iberdrola |
china datang | inter rao |
china energy investment corp (ceic) | jpower |
china general nuclear power corp (cgn) | kansai electric |
china huadian | korea electric power corp (kepco) |
china huaneng | nextera |
china resources power holdings | nrg energy |
china three gorges power (ctgpc) | ntpc |
chubu electric power | nuclear power corp of india (npcil) |
comision federal de electricidad (cfe) | pt pln |
dominion | russian government |
duke energy | rwe |
edf | saudi electricity co (sec) |
egyptian electricity holding co (eehc) | southern co |
electricity generating authority of thailand (egat) | state power investment corp (spic) |
eletrobras | taiwan power (taipower) |
enel | tennessee valley authority (tva) |
energoatom | vattenfall |
engie | vietnam electricity (evn) |
entergy | vistra energy |
eon | zhejiang zheneng elec pow co |
Methodology
Carbon performance refers to the greenhouse gas emissions per product or service sold. It tells about the ability of a company to produce and sell with minimum greenhouse gas emissions per unit of product sold.
Because there are significant discrepancies in how companies worldwide account for their GHG emissions, we use an asset-based and data science-driven methodology. We do not rely on companies’ sustainability reports and GHG disclosure.
We independently compute corporate carbon footprint and carbon performance indicators. This methodology makes the ranking homogeneous, reliable, and independent of companies’ self-declared GHG emissions.
We do not seek high precision; instead, we make sure to compute a like-for-like comparison of companies. Our methodology for the electricity sector relies on asset-based data at the power plant level across the world. We compute the total electricity production of 22,000 producers worldwide by type of energy sources. To compute carbon performance, we associate each plant to its parent company.
We use average CO2e emissions per kilowatt produced to assess the carbon intensity of producers. The ranking reflects the carbon intensity of the sources of energy used by electricity producers and the mix of energy sources in their production.
We take a full life cycle approach to provide the most accurate view of carbon performance in the electricity sector.
We use IPCC data on the carbon intensity of primary energy sources.
To estimate future emissions, we consider expected openings and closings of plants, which allows us to estimate the trajectory of electricity producers.
For readability, the map featured at the top of the article shows the top 13,000 plants worldwide with a capacity of over 50 MW. Plants are classified into three intensity categories: high (coal and oil), medium (gas), and low (renewables and nuclear). You can zoom in to see the map in more detail. The exact location of some plants was missing. Although some may not appear on the map or be approximately localized in their country, we take them into account in our calculations.
Limitations of the model
We seek comparability rather than precision in assessing companies’ carbon performance. This results in the following limitations:
Although our data covers 75% of electricity capacity worldwide, we miss power plants in some countries.
We do not have generation data per plant. We hence derive energy generation from power plant capacity utilization factors, energy sources, and historical data using correlation models. This can lead to underestimation or overestimation of generation data.
We match all plants with their respective parent companies. Some errors may occur in entity name resolution and attribution. To reduce this error, we cross-check capacity figures from selected companies' annual reports.
We use expected and announced openings and closings of plants to project future emissions, but companies may change their plans.
Sources
Climate Change 2014, Mitigation of Climate Change. Summary for Policymakers and Technical Summary, IPCC, 2014. https://www.ipcc.ch/site/assets/uploads/2018/03/WGIIIAR5_SPM_TS_Volume-3.pdf
Enerdata https://www.enerdata.net/
International Energy Agency https://www.iea.org/
Renewable Energy Sources and Climate Change Mitigation, IPCC 2011 https://www.ipcc.ch/site/assets/uploads/2018/03/SRREN_Full_Report-1.pdf
World Energy Data, 2021 https://www.worldenergydata.org/world-electricity-generation/#footnote_0_9196