We have analysed and computed the carbon emission performance of 48 automakers representing 99% of worldwide sales.
This first part provides an overview of challenges in the transition to a low carbon economy and key issues to have in mind to understand carbon footprint and assess carbon performance in the automotive industry.
At Carbometrix, we provide indicators and insights to compare corporate performance on greenhouse gas emissions. We believe transparency, consistent data, and benchmarks are essential tools to help decision-makers exert their influence to transition to a low carbon economy and motivate companies to transform their operations and reduce their emissions.
Why do emissions matter?
The automotive sector has a crucial role to play in advancing the transition to a low carbon economy. Indeed, the industry is a significant greenhouse gases (GHG) emitter: 4Gt of CO2e (CO2 equivalent) per year, i.e., 8% of global anthropogenic emissions.
Environmental challenges
Automakers face environmental challenges. They have to significantly reduce their GHG emissions to meet the goals of the United Nations Paris agreement. Getting automakers on track requires implementing a broad set of decarbonization levers: fleet electrification, improving fuel efficiency of thermal cars, building lighter cars, etc.
Regulatory pressure
On top of environmental issues, there are mounting regulatory challenges associated with vehicle fuel usage. Most western countries are concerned.
The European Union has set a goal for car manufacturers for 2021: their average car’s physical intensity should not exceed 95gCO2/km. The EU Fit For 55 program bans the sale of new petrol and diesel cars from 2035.
In the US, the Biden administration executive order has set an ambitious target under which half of the new vehicles sold from 2030 will have to be electric.
UK PM’s green plan will ban new conventional petrol and diesel cars sales from 2030.
As all countries are increasingly aware of the climate emergency, we can expect new and stricter regulations on automotive manufacturers.
Where do emissions come from?
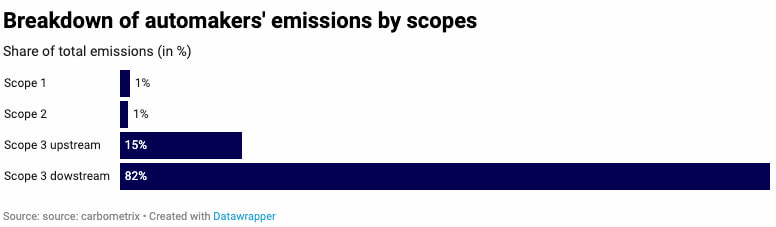
Most car manufacturers’ GHG emissions do not come from building the car itself. Instead, what matters is the emissions that occur when the vehicle is driven, i.e., when diesel or gasoline is burned in internal combustion engine vehicles. Our computation shows this category, also known as scope 3 downstream, represents over 80% of an automaker’s carbon footprint in GHG protocol standard.
Most of the remaining emissions belong to the upstream segment of the value chain (i.e., scope 3 upstream): raw material extraction, transformation, and transportation. This emission category is not studied in this report as we focus on the most material part of the carbon footprint that is heavily regulated. Direct emissions (scope 1) and emissions from electricity purchase (scope 2) represent 2% of an automaker’s carbon footprint.
How to assess carbon performance in the auto industry?
We use typical industry indicators to assess performance: physical intensity and share of electric vehicles in sales. Physical intensity, expressed in gCO2e/km, represents the quantity of CO2e emitted per kilometer driven by the car.
Regulators rely on these same indicators. Physical intensity is used in the EU Taxonomy as the technical criteria to qualify a vehicle as “green.” Government decarbonization plans ban cars based on their engine type (electric vehicles favored against hybrid and combustion engines). Hence, these are good proxies to assess companies’ maturity in their decarbonization journey and exposure to climate transition risks.
Norms
We calculate automakers’ physical intensity using the WLTP protocol. WLTP stands for Worldwide Harmonized Light Vehicles Test Procedure. It is an EU vehicle homologation protocol that specifies a test cycle and a procedure to measure fuel consumption, CO2 emissions, and regulated light vehicle pollutants under standardized (laboratory) conditions. It provides accurate and comparable emissions data for different car models. It is used worldwide and considered to be a fair assessment of vehicles’ carbon performance.
The WLTP protocol only measures “tank-to-wheel” (TTW) emissions, i.e., fuel emissions once in the car’s tank. While burning diesel emits CO2, using electricity does not. Within this framework, electric vehicles are not emissive at all, which is not entirely true.
Car engine performance
In this study, we also calculate “well-to-wheel” (WTW) emissions. The WTW approach gives a complete picture of GHG emissions. It considers total emissions, from oil extraction or electricity production to emissions once in the car. It is essential for electric vehicles, as it considers the carbon intensity of electricity production. An electric car driven in a country that relies on coal for its electricity production is highly emissive.
The sales mix of automakers on the different engines plays a crucial role in their relative carbon performance. The graph below shows how the same car model’s emissions can vary greatly depending on its engine.
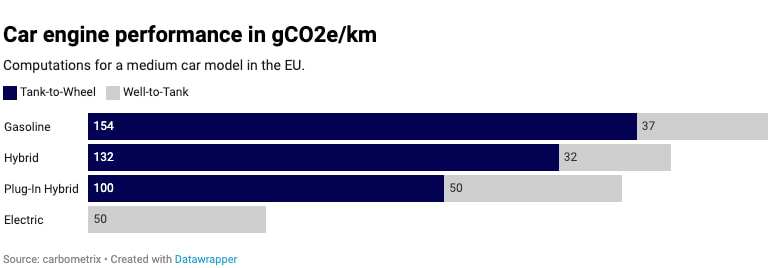
The most emissive cars are the ones powered by thermal engines.
Plug-in hybrid cars use external energy sources to produce electricity, while non-plug-in hybrid recapture energy created while driving and use gas to charge and maintain the battery. Consequently, the carbon intensity of electricity production is only relevant for plug-in hybrid and electric cars.
Plug-in hybrid cars and electric cars can be the least emissive types, depending on the country in which they are used.
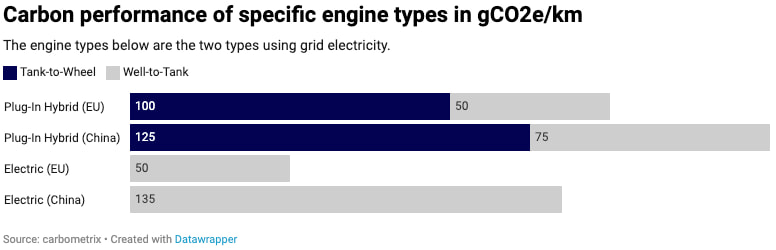
We computed the carbon intensity of electricity in China and the EU. Chinese electricity production is highly reliant on fossil fuels. On average, electricity is less carbon-intensive in the EU. The decarbonization of the car industry goes hand in hand with the decarbonization of electricity production.
How is the market moving?
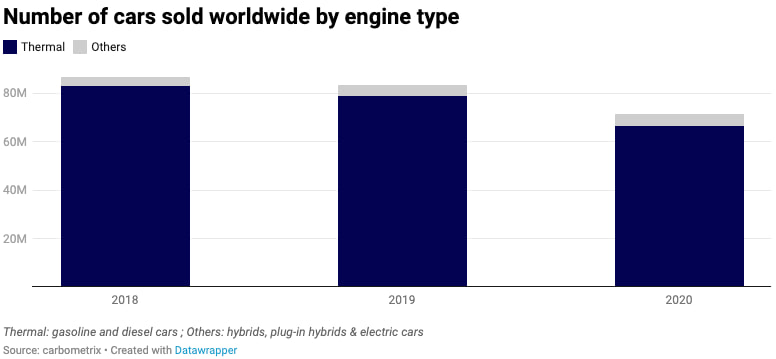
Thermal cars dominate the market, with 95% of all new passenger cars sold worldwide in 2020. Electric and hybrid cars represent respectively 2% and 3%, with a slow increase over the past few years.
To be continued in part II with automakers carbon performance and ranking.